
QUANTUM has developed a range of frameworks, methods, and tools to support the assessment of health data quality, utility, and organisational readiness within the European Health Data Space (EHDS). Explore the different components below to learn more about the project’s key results.
1. Conceptualisation of data quality and utility
2. Defining the Data Holders’ Maturity Framework
3. The QUANTUM fitness-for-purpose approach
4. Landscape analysis of existing data quality technologies and tools
1. Data quality and utility dimensions
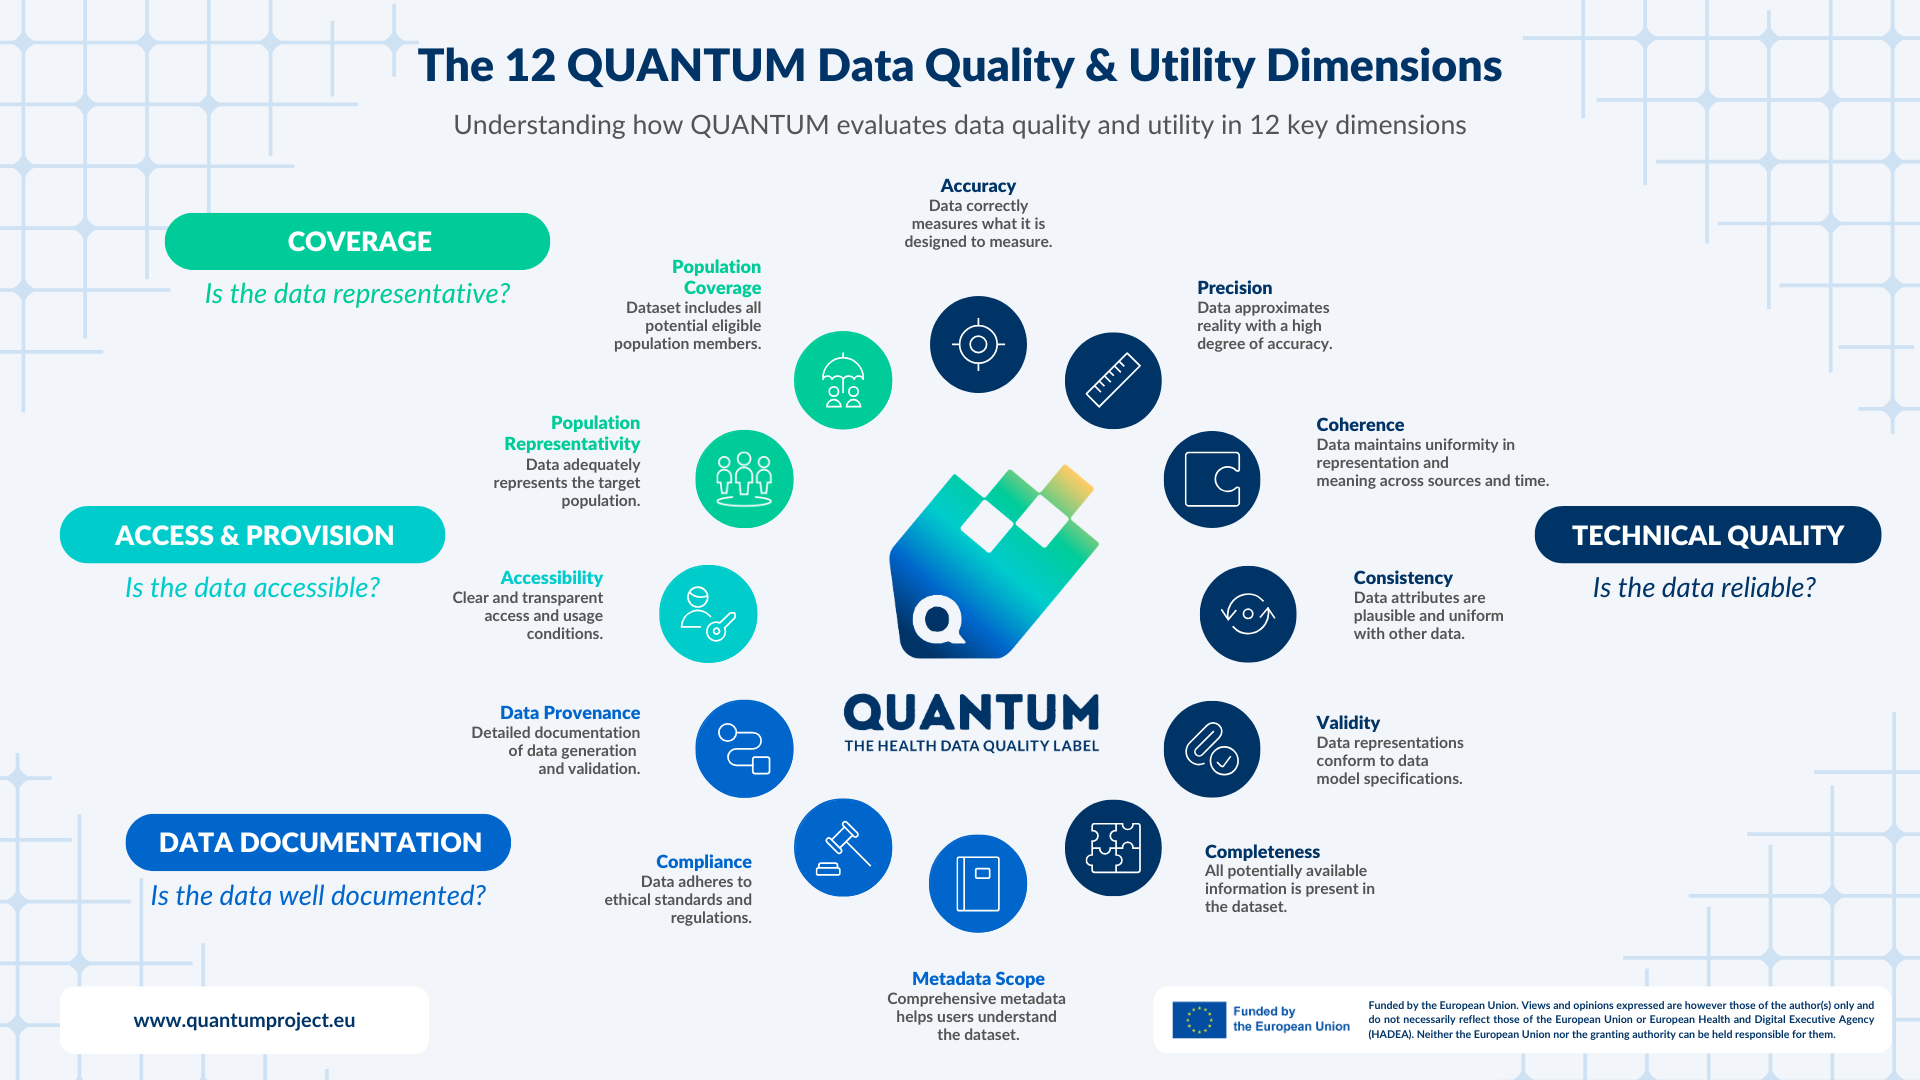
This section presents the data quality and utility dimensions developed within QUANTUM, which form the basis of the labelling approach. Starting from 54 dimensions identified through literature review and expert consultation, a Delphi consensus process led to a prioritised set of 26 dimensions and a final core set of 12. These dimensions describe key aspects of dataset quality and potential utility in the context of health data reuse within the European Health Data Space (EHDS). They are complemented by agreed metrics, value ranges, and weighting rules used to structure how dataset quality is measured and scored.
View the 12 data quality & utility dimensions infographic
➜ Further reading: Deliverable 1.1 - Specification of the data sets' quality and utility label
2. Data holders’ maturity framework
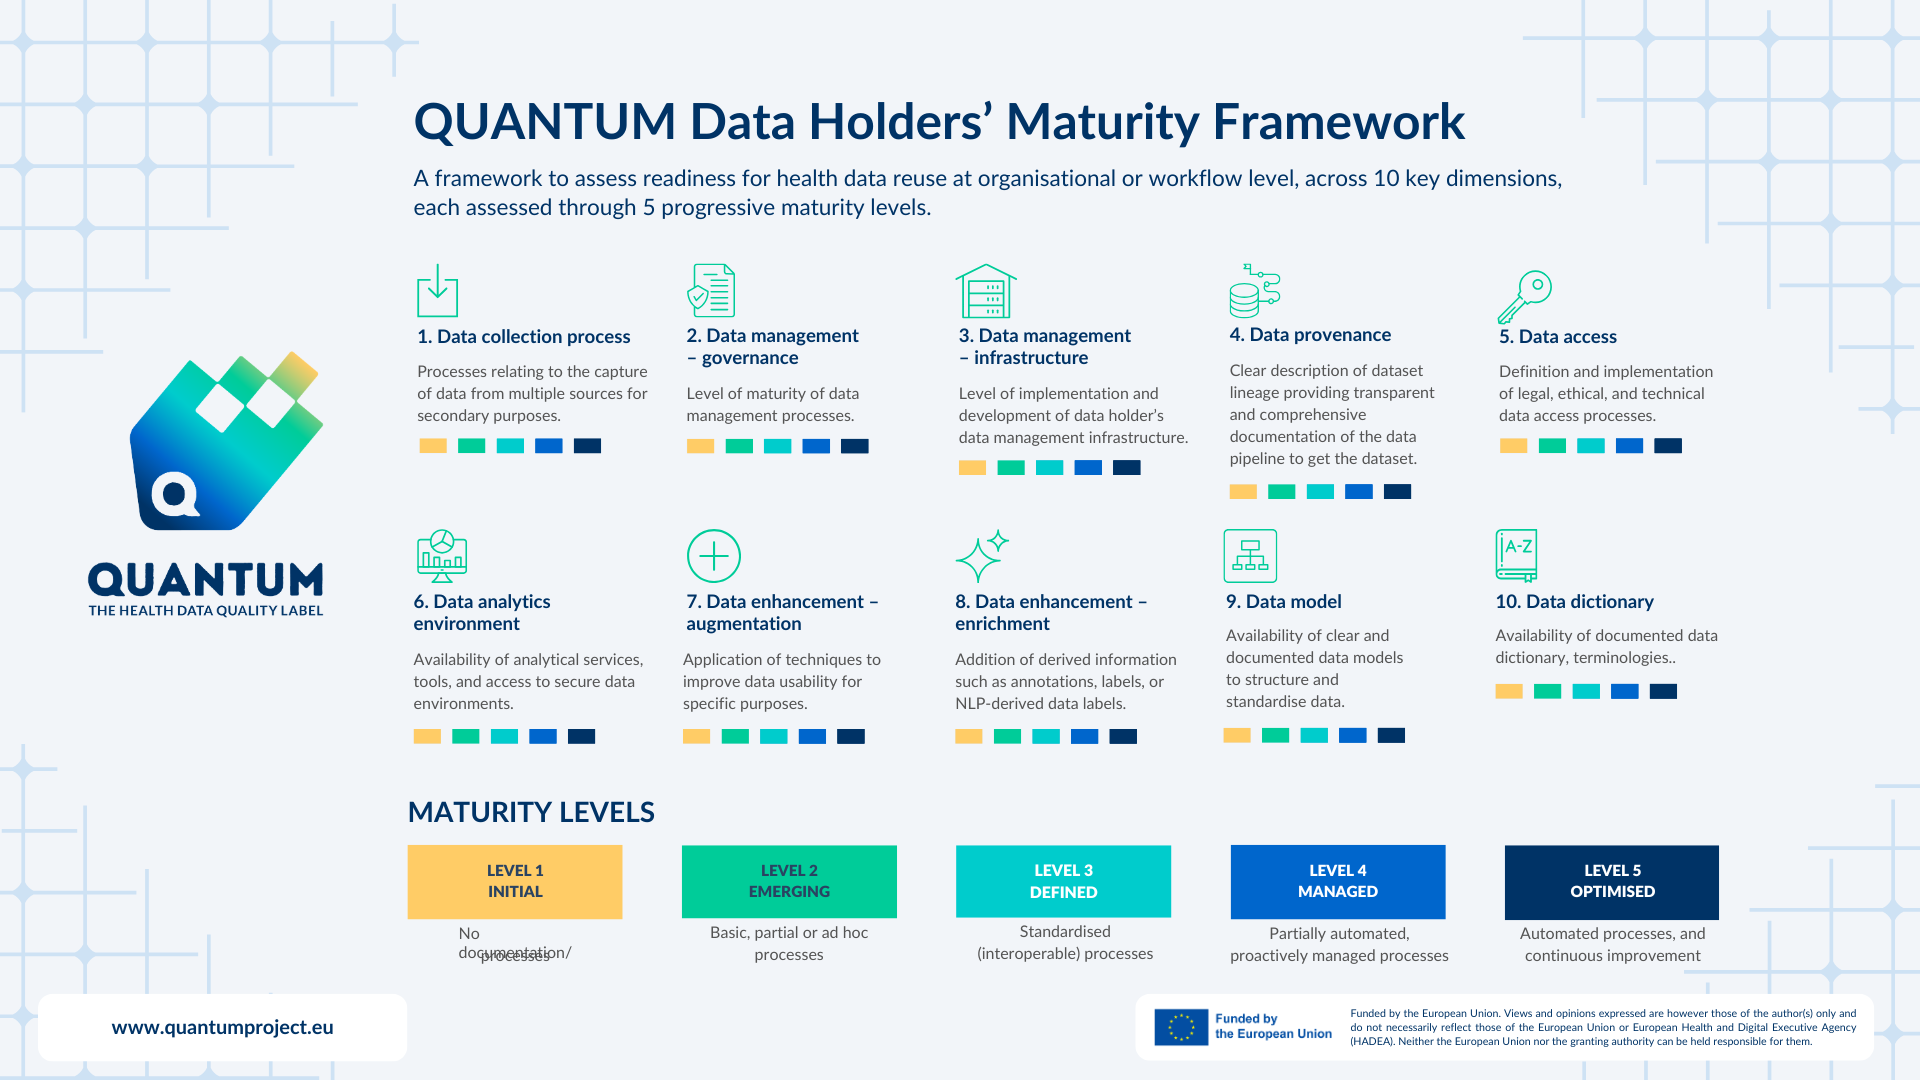
This section presents the Data Holders’ Maturity Framework developed in QUANTUM to assess how well organisations are equipped to manage data and ensure data quality. The framework covers ten key dimensions, including governance, infrastructure, data access, and data modelling. Each dimension is assessed across five progressive maturity levels, from initial to optimised.
The framework supports structured self-assessment and continuous improvement over time. It can be applied at organisational level or across several data governance workflows within the same organisation, where maturity may differ between domains or data pipelines.
View the maturity matrix infographic
➜ Further reading: Deliverable 1.2 - Specification for the assessment of data holders’ maturity
3. QUANTUM fitness-for-purpose approach
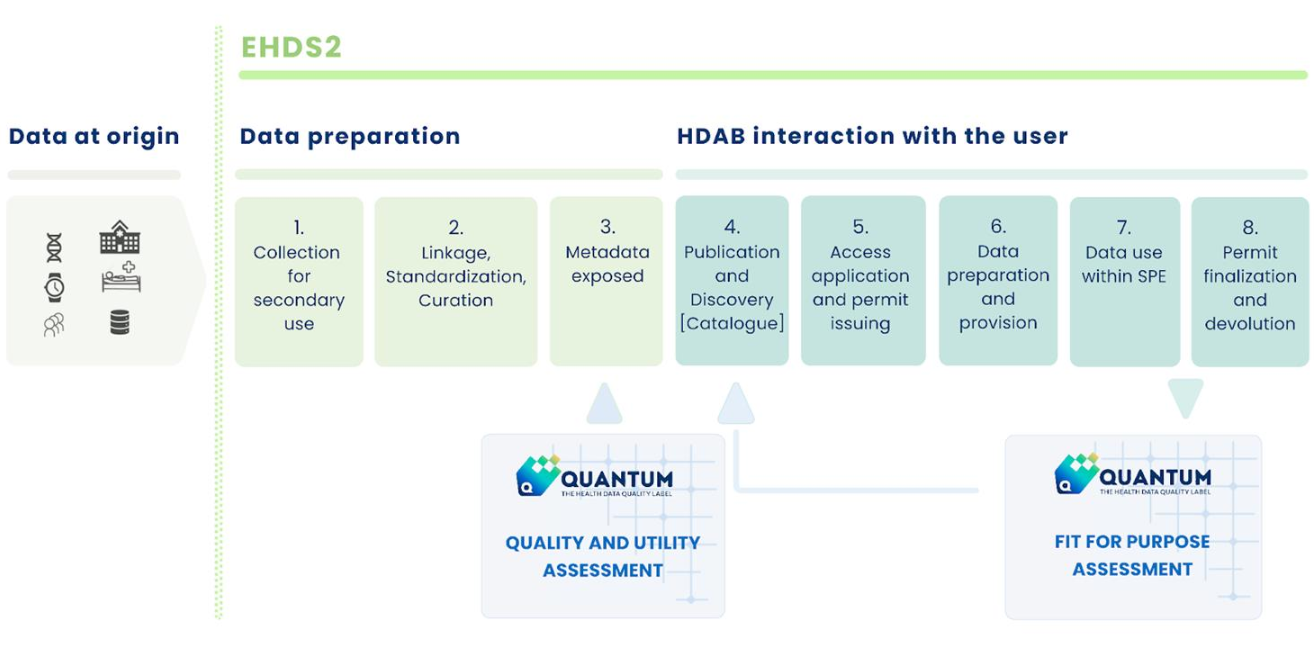
The Fitness-for-Purpose (F4P) mechanism developed by QUANTUM complements the Data Quality, Utility and Maturity label by capturing user perspectives on how well datasets serve specific reuse purposes within the EHDS. While the QUANTUM label assesses dataset quality before access, F4P evaluates real-world utility after use, helping determine whether datasets are truly suitable for their intended applications, such as research, public health, or AI development.
Learn more about the QUANTUM fitness-for-purpose approach
The F4P system is user-driven and purpose-linked. After completing their analysis, data users provide feedback on how suitable a dataset was for the purpose selected in their access application. Feedback may include scores, dimension-specific insights, free-text comments, and supplementary materials such as code scripts or research outputs.
Evaluations are validated by Health Data Access Bodies (HDABs) and, in many cases, reviewed by Data Holders before publication. This helps ensure feedback is accurate, fair, and actionable.
Once validated, feedback becomes visible through EHDS catalogues alongside dataset metadata and the QUANTUM label. Integrated visualisation tools allow users to explore dataset performance by purpose, quality dimensions, scores, and usage frequency.
The mechanism relies on semantic interoperability through RDF, ensuring machine-readable linkage between dataset metadata, permits, and user feedback.
➜ Further reading: Towards Fitness-for-Purpose Assessment in HealthData@EU
4. Landscape analysis of existing data quality tools and technologies
One of QUANTUM’s first activities was to assess existing technologies and tools relevant for data quality labelling. Combining a systematic literature review with a survey of 27 European Data Holder institutions, this landscape analysis explored current practices, technologies, and gaps to inform the design of the QUANTUM labelling tool.
Key findings and recommendations
› A diverse but fragmented ecosystem
The analysis identified 66 open-source tools relevant to data quality assessment, with roughly half being general-purpose solutions and the other half specialised for domains such as omics, imaging, or electronic health records. The institutional survey confirmed strong heterogeneity in practice, with Data Holders combining in-house scripts (R, Python, SQL), open-source platforms, and commercial tools. This diversity reflects different contexts and maturity levels, but also highlights the absence of a common or standardised approach to data quality assessment across organisations.
› Key structural gaps
A central finding is the lack of interoperability between existing approaches, as tools and methods are typically developed independently, rely on different metrics, and are not designed to exchange results in a standardised format. This limits comparability and creates barriers for cross-border reuse of health data within the EHDS. The analysis also highlights clear maturity disparities between institutions, where some organisations have automated and structured data quality processes, while others still rely on manual or ad hoc approaches, creating important implications for any EU-level framework that must remain usable across very different levels of readiness.
› What this means for QUANTUM
These findings directly informed the design principles of the QUANTUM framework, which does not aim to replace existing systems but to integrate with them by working alongside current tools and workflows. Interoperability is a core requirement, with machine-readable outputs aligned to EHDS metadata standards, including RDF-based representations. The framework is also intentionally modular, allowing organisations to start with a core set of metrics and progressively extend their assessment as maturity increases. Finally, the approach is designed to be practical and testable in real-world settings through pilots with Data Holders, rather than remaining a purely conceptual model.
› Results of some of the questions related to the data quality tools in the survey
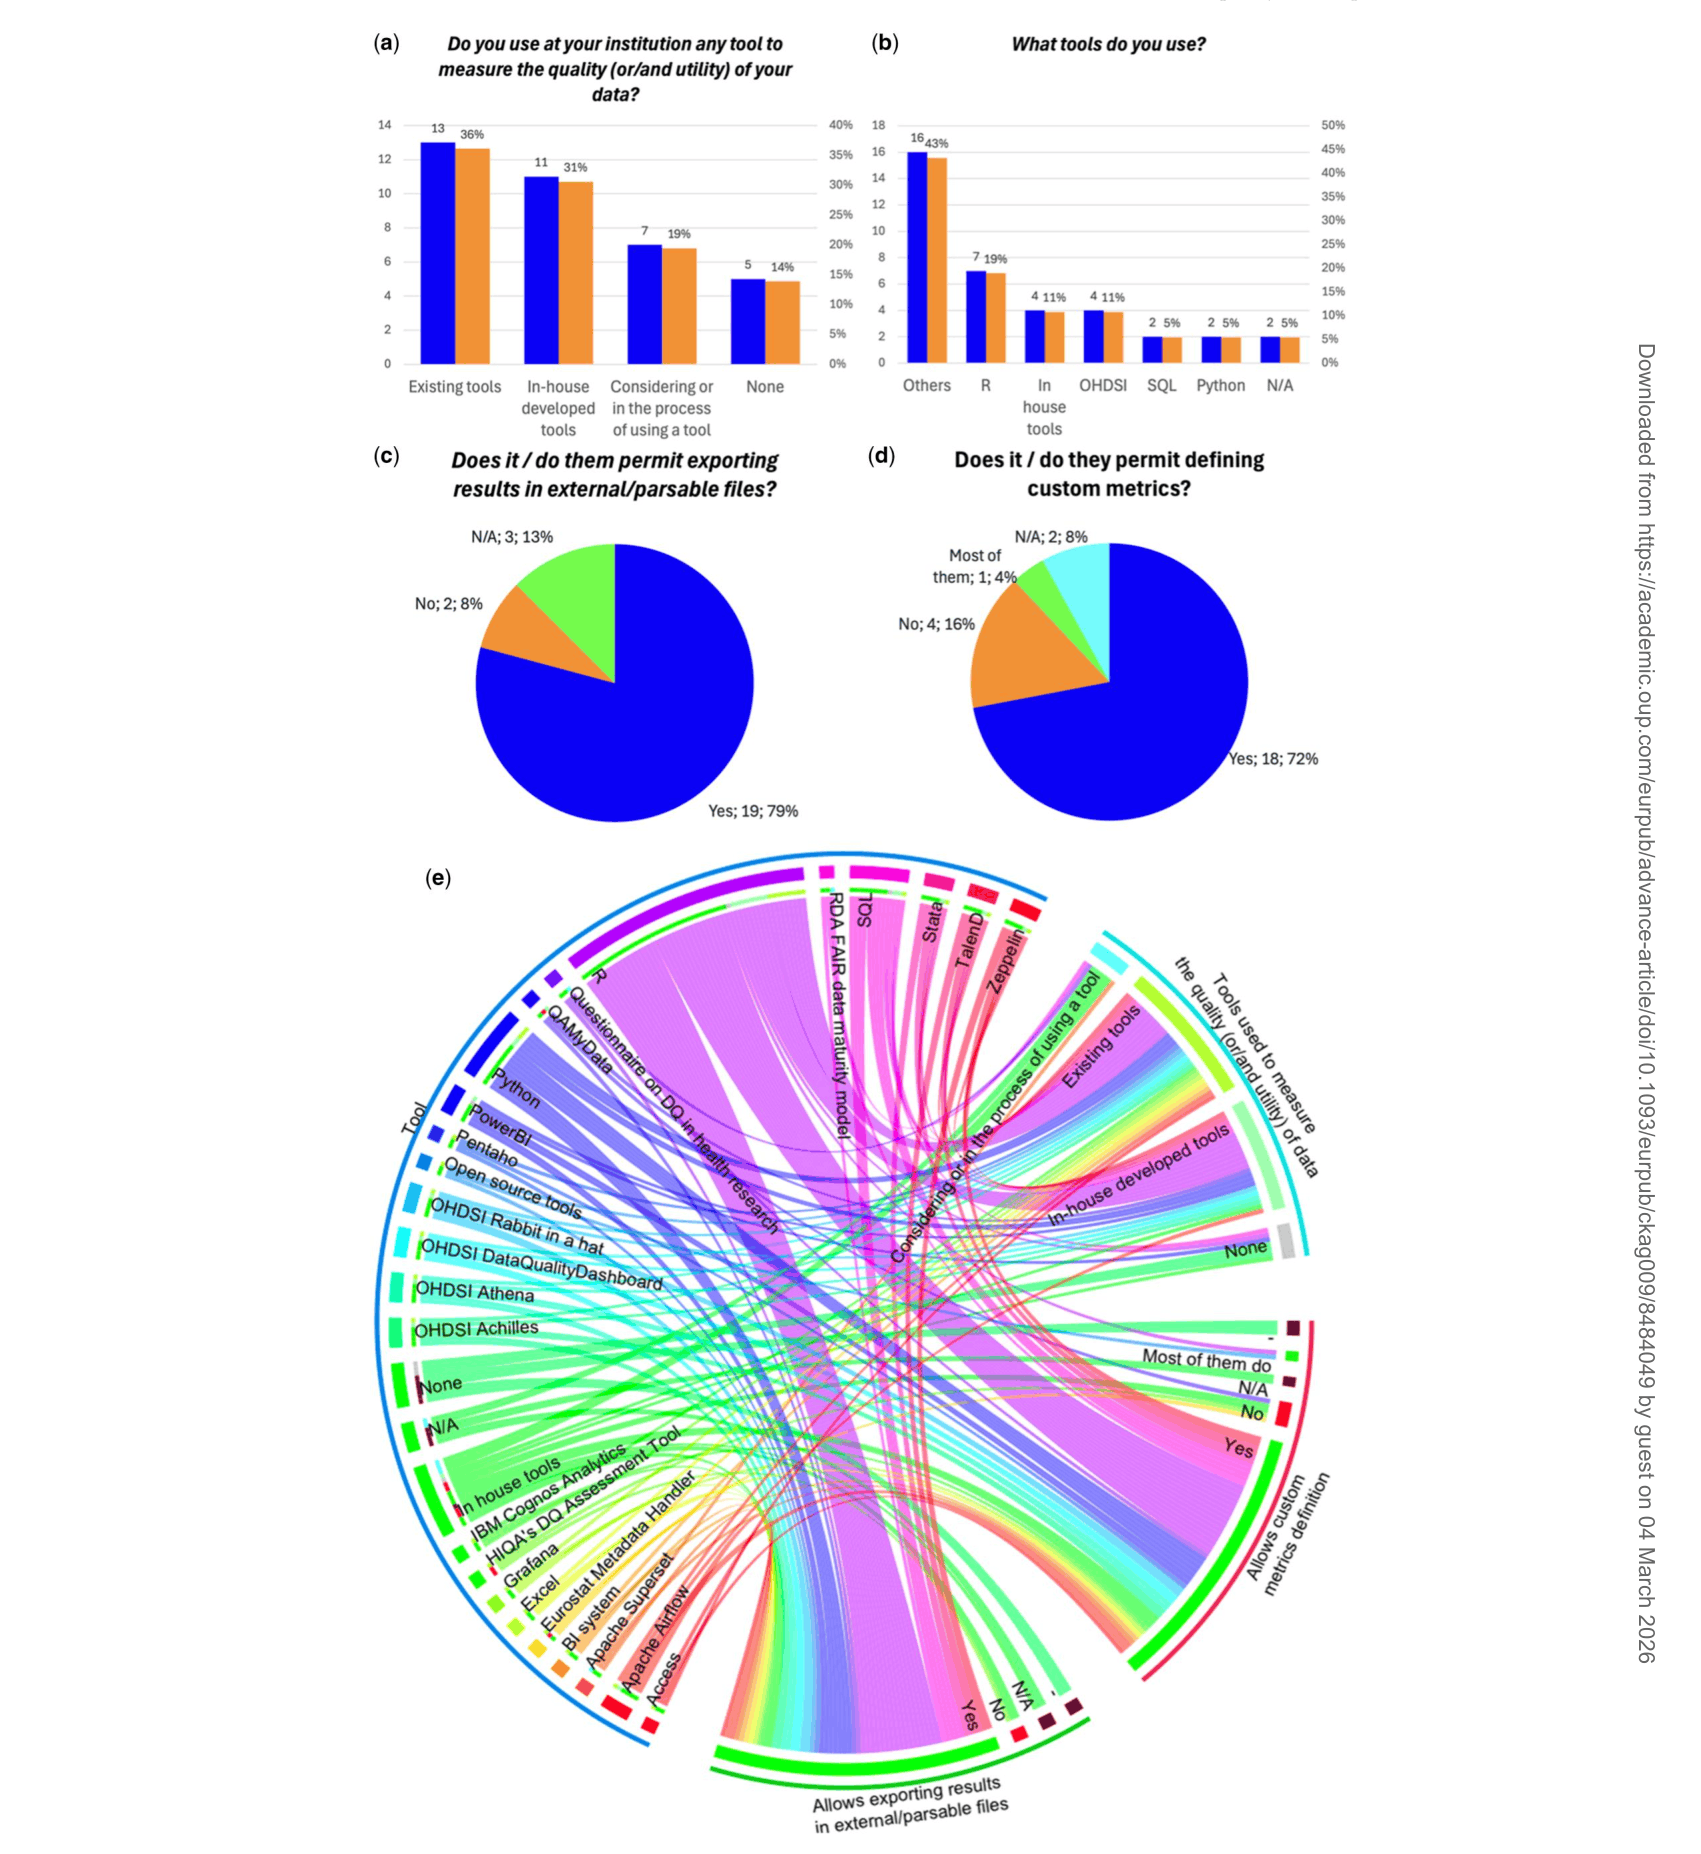
a) the type of tools used for measuring data quality (or/and utility) of the data holder data;
b) what tools the data holder use, meaning ‘Others’ as all the tools that are mentioned once;
c) if the data holder tools permit exporting results;
d) if the data holder tools permit defining custom metrics;
e) the relation between the values of the questions. a)–d) represented in a Chord diagram. The bar charts are expressed in absolute frequencies, and the pie charts in percentage. The Chord diagram visualises co-occurrences among tool types, specific tools, exportability, and custom metric capability. Each segment represents a category, and ribbons indicate institutions that report both characteristics, with the thickness of the ribbons reflecting the frequency. Colours correspond to the categories in the outer ring. For example, thicker ribbons between ‘R/Python scripting’ and ‘Custom metrics’ indicate that most institutions using these tools also report customisation capabilities. N.B.R and Python include scripting and libraries besides the programming language.